组成图示
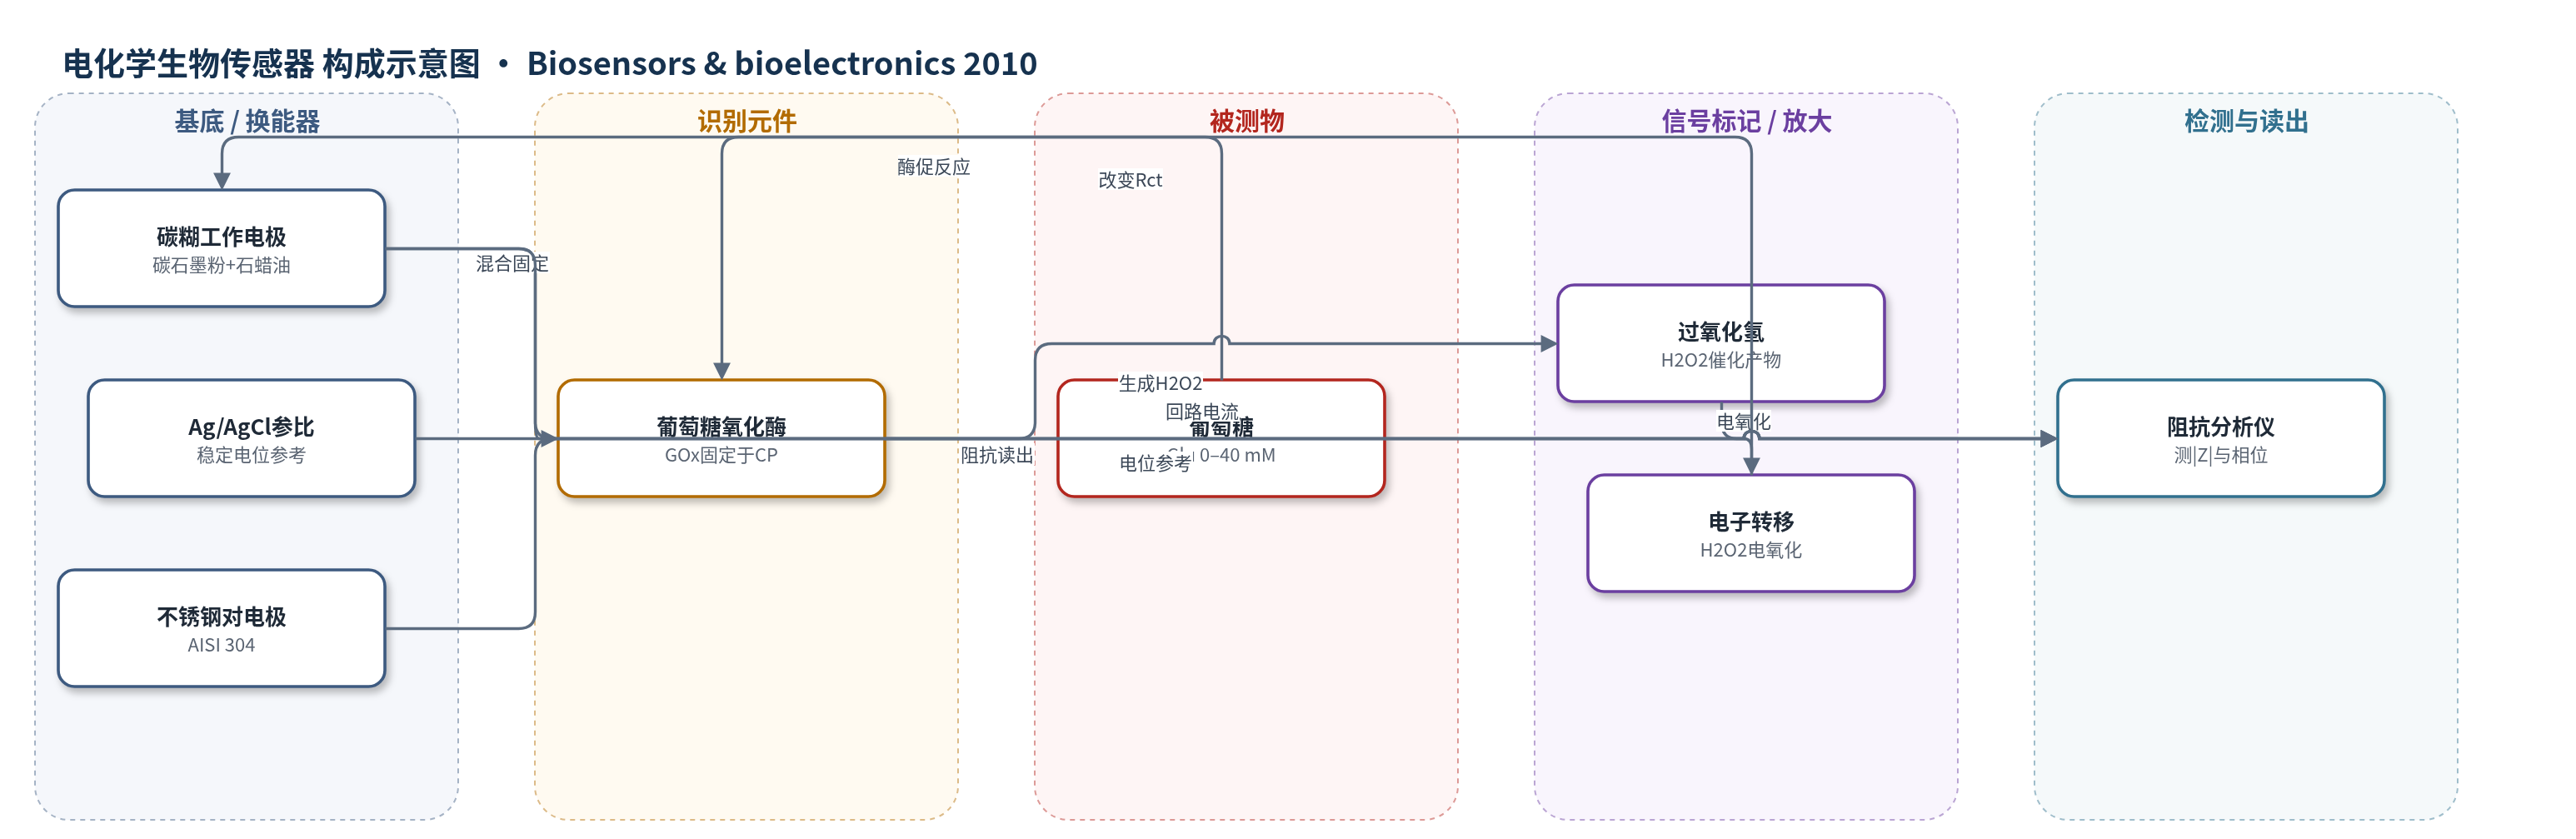
点击图片查看大图 · 依据论文自动绘制
传感器类型
电化学生物传感器
检测对象
葡萄糖(glucose, Glu);样品基质:0.07 M KH2PO4/Na2HPO4 缓冲液(pH 7,含0.1 M KCl)
检测原理
该传感器为第一代酶电极。GOx 固定于碳糊中,催化葡萄糖与氧气反应生成葡萄糖酸和过氧化氢(H2O2)。在 900 mV 直流偏置下,H2O2 在碳糊界面发生电氧化,释放电子并增加界面电荷,使电荷转移电阻 Rct 下降。系统再叠加 50 mV RMS、0.4 Hz 交流信号,频率响应分析仪测量传感器—溶液界面的复阻抗幅值 |Z| 和相位。葡萄糖浓度升高时,酶促反应速率增大,H2O2 生成及电氧化电流增强,Rct 进一步降低,|Z| 与相位发生可重复变化。采用单频阻抗测量避免多频拟合,实现实时读出;校准曲线呈双曲线,类似 Michaelis–Menten 动力学。
检测灵敏度
线性范围: 0–10 mM(低段 2–10 mM 线性拟合);测量范围: 0–40 mM;双曲线拟合范围: 5–40 mM;R^2: 0.999(|Z|双曲线拟合)、0.998(相位双曲线拟合);与比色法相关: r2 = 0.98。
效应效果
阻抗响应具有酶促特异性:不加葡萄糖或不含 GOx 的碳糊电极均无明显变化,而碳糊电极对 H2O2 有响应,说明信号来自葡萄糖生物电催化。重复性良好,高低浓度范围归一化阻抗 RSD 均小于 5%;四个传感器各测五次未知样品,ANOVA 显示 |Z| 与相位均值无显著差异(p=0.32、p=0.40)。与比色法比较,r2=0.98,t 检验 p=0.44;线性范围内准确度在真实值 8% 以内,精密度 RSD 为 12%、9%、19.6%(由高到低)。相比计时电流法,时序阻抗法交流电流 0.1–0.4 mA,抗干扰更强,可低成本实时连续监测。
传感器的构成
- 工作电极基底:碳糊(CP,碳石墨粉与石蜡油)提供导电介质、低电阻和酶固定基质
- 识别元件:葡萄糖氧化酶(GOx,Aspergillus niger type VII)固定于碳糊中,催化葡萄糖氧化
- 电极封装与电接触:亚克力管(内径8 mm、高2 mm)承载碳糊,24K金盘提供电接触
- 信号转换层:无外源标记物;GOx 催化生成 H2O2,H2O2 在 900 mV 下电氧化并改变界面阻抗
- 参比电极:Ag/AgCl 电极,提供稳定电位参考
- 对电极:AISI 304 不锈钢凹形电极(直径85 mm),完成三极电化学回路
- 电解液介质:0.07 M KH2PO4/Na2HPO4 缓冲液(pH 7,含0.1 M KCl),提供离子导电与反应环境
中文摘要
本文建立了一种基于葡萄糖氧化酶/碳糊电极(GOx/CP)的第一代葡萄糖生物传感器,并采用时序阻抗技术(CIT)实现葡萄糖浓度的实时测定。传感器以 900 mV 直流偏置叠加 0.4 Hz、50 mV RMS 交流信号进行极化,利用频率响应分析仪测量传感器—溶液界面的复阻抗幅值 |Z| 和相位。在 0–40 mM 范围内连续加入葡萄糖进行实时测量,并基于累积阻抗剂量—响应曲线分别对幅值和相位建立校准曲线,其中双曲线拟合效果最佳。共制备 4 个传感器,每个获得 5 条校准曲线,并在每次校准后进行一次未知葡萄糖浓度样品测试。校准曲线估算的葡萄糖浓度与比色法参考方法结果进行比较;单因素方差分析表明,幅值与相位的均值差异均无统计学意义(p>0.01),Student t 检验所得 p 值均≤0.44。结果表明,CIT 是一种可靠的实时葡萄糖浓度测定方法,具有较高重复性,并与比色法良好一致(r2=0.98)。
英文摘要
The chrono-impedance technique (CIT) for real time determination of glucose concentration in a first generation glucose oxidase/carbon paste electrode was implemented. The biosensor was polarized with a signal composed of 900 mV DC potential and 50 mV(RMS) AC signal at 0.4 Hz. A frequency response analyzer was used to measure the complex impedance (magnitude |Z| and phase (Φ)) of the biosensor-bulk interface. Real time measurements were performed while glucose was added to the bulk within a concentration range of 0-40 mM. The cumulative impedance dose-response curves were used to construct calibration curves, both for magnitude and phase. The best fitting was obtained with a hyperbolic equation. Four biosensors were built obtaining five calibration curves for each of them. A single test measurement (unknown glucose concentration) was also obtained after each calibration procedure. Glucose concentrations were estimated with the calibration curves and also measured by colorimetry, the latter being the reference method. Besides, one-way ANOVA test evaluated repeatability. Difference between means was not statistically significant (p>0.01) for both magnitudes (|Z| and Φ). The Student's t-test assessed the differences significance, which produced in all cases p levels lower or equal than 0.44. Thus, CIT was proved to be a reliable method to measure glucose concentration in real time. Moreover, it showed high repeatability and compared well against colorimetry (r(2)=0.98).