组成图示
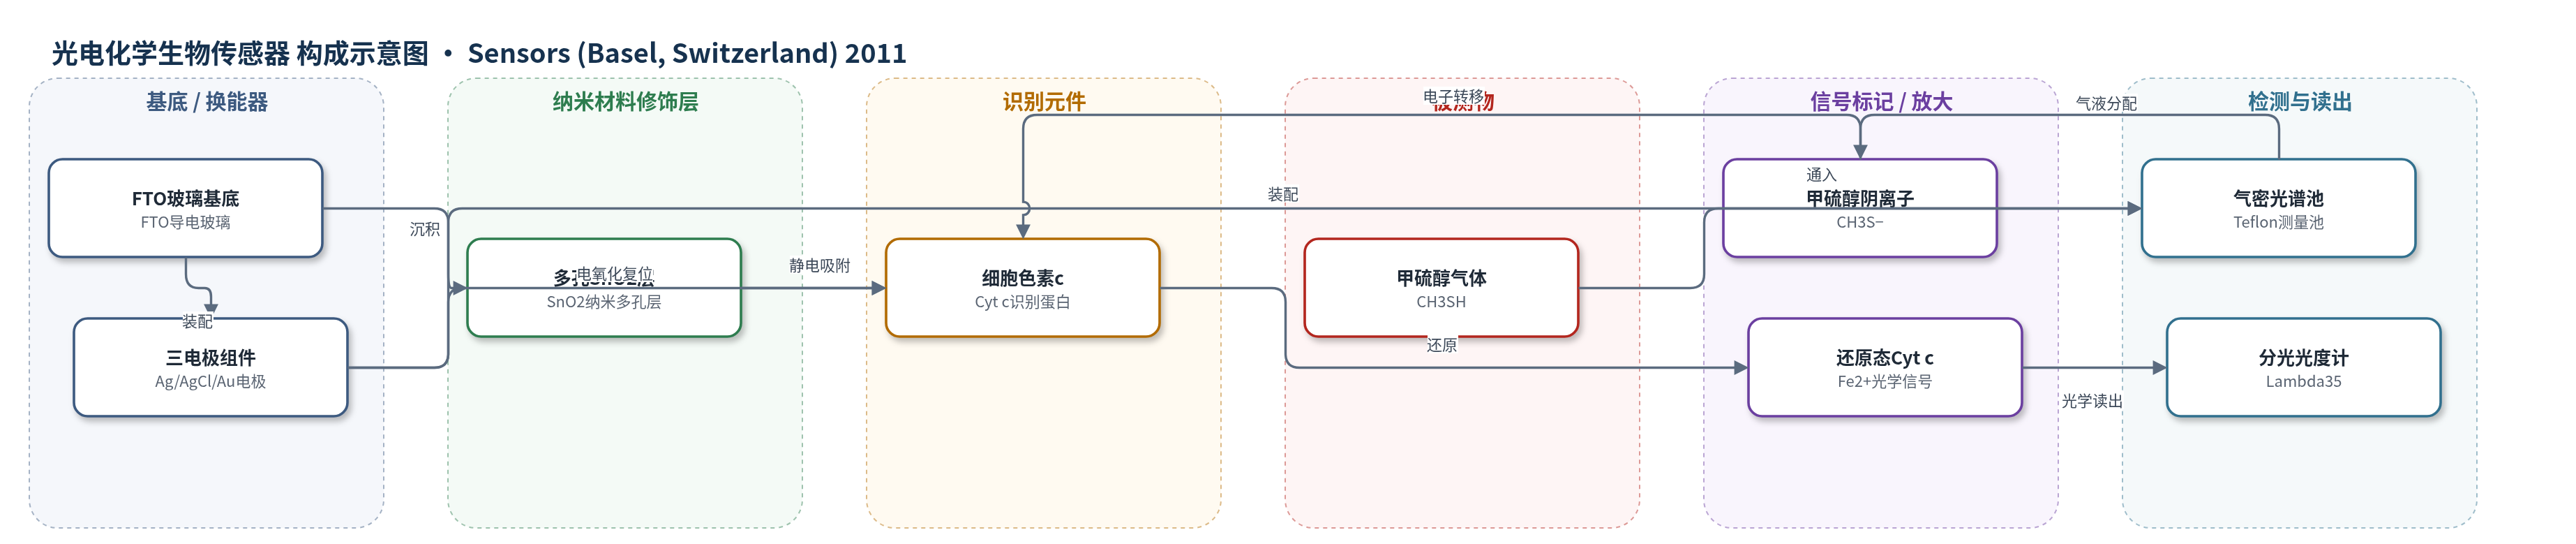
点击图片查看大图 · 依据论文自动绘制
传感器类型
光电化学生物传感器
检测对象
甲硫醇(methanethiol, CH3SH);样品基质:气相/湿润空气(humidified air/gas sample)
检测原理
甲硫醇从气相经气液分配进入明胶水凝胶和多孔SnO2液相,溶解浓度由Henry定律决定;在中性pH下部分解离为甲硫醇阴离子CH3S−,并扩散至SnO2层。传感器先通过电化学氧化将细胞色素c置于Fe3+态,该态在550 nm无吸收峰。CH3S−与氧化态Cyt c发生单电子转移,将Cyt c还原为Fe2+,使550 nm吸收增加。反应为双分子二级过程,速率v=k[Cyt c_ox][CH3S−],吸光度变化率按Lambert-Beer定律换算。气体浓度升高时,液相溶解浓度和CH3S−浓度增加,Cyt c还原速率及550 nm吸光度上升速率随之增大。
检测灵敏度
原文未报告LOD、线性范围、灵敏度斜率或R^2;100 ppm CH3SH下模型预测吸光度变化率为2.0 × 10⁻⁴ absorbance units per minute,实验平均为3.6 × 10⁻⁴ ± 0.4 × 10⁻⁴ absorbance units per minute。
效应效果
该传感器在100 ppm甲硫醇气体下产生可重复光学响应,三次暴露平均吸光度变化率为3.6 × 10⁻⁴ ± 0.4 × 10⁻⁴ absorbance units per minute,与模型预测2.0 × 10⁻⁴同数量级。细胞色素c耐受制备和过程步骤,传感器可支持60 min内重复测量,干燥后可通过湿润环境再生。选择性方面,氧气不干扰,但其他可与细胞色素c反应的氧化还原物质可能干扰;pH需约7、盐浓度需生理水平或以下,以防脱附。该工作展示气相直接检测硫醇的可行性,并强调模型可加速气体生物传感器开发。
传感器的构成
- 基底/换能器电极:FTO导电玻璃(FTO-coated glass),提供透明导电基底与电极界面
- 纳米材料修饰层:多孔SnO2层(SnO2,10 nm颗粒,2.5 µm厚,BET 78 m2/g,孔径16 nm),作为透明电极和细胞色素c静电吸附载体
- 识别元件:细胞色素c(cytochrome c, Cyt c,~12 kDa),静电结合于SnO2,作为氧化还原识别与光学信号蛋白
- 保护层/液相反应室:明胶B型(gelatin type B,35 mg/mL旋涂,200 nm厚),作为电解质、保护层和水合液相反应室
- 参比电极:Ag/AgCl浆料(Ag/AgCl paste),印刷于自粘箔上,提供参比电位
- 对电极:金(Au)热蒸发层,印刷于自粘箔上,作为对电极
中文摘要
本文报道了一种基于细胞色素c的气体生物传感器,重点分析传感过程并建立数学模型以预测传感器响应。气体生物传感涉及气液分配平衡、中间反应、质量传输和反应动力学等多个步骤,这些过程发生在气相与液相之间及各自相内。作者对各步骤进行定量描述,并将其整合为统一模型,用于预测生物传感器响应。研究以甲硫醇气体检测为例,模型利用文献物性参数和简单液相实验数据预测光学读出信号,并通过平面三电极光电化学生物传感器在气密光谱电化学测量池中接触甲硫醇气体进行实验验证。结果表明,模型预测值与实验值处于同一数量级,说明该模型可为气体生物传感器开发提供定量指导。
英文摘要
This work is about gas biosensing with a cytochrome c biosensor. Emphasis is put on the analysis of the sensing process and a mathematical model to make predictions about the biosensor response. Reliable predictions about biosensor responses can provide valuable information and facilitate biosensor development, particularly at an early development stage. The sensing process comprises several individual steps, such as phase partition equilibrium, intermediate reactions, mass-transport, and reaction kinetics, which take place in and between the gas and liquid phases. A quantitative description of each step was worked out and finally combined into a mathematical model. The applicability of the model was demonstrated for a particular example of methanethiol gas detection by a cytochrome c biosensor. The model allowed us to predict the optical readout response of the biosensor from tabulated data and data obtained in simple liquid phase experiments. The prediction was experimentally verified with a planar three-electrode electro-optical cytochrome c biosensor in contact with methanethiol gas in a gas tight spectroelectrochemical measurement cell.