组成图示
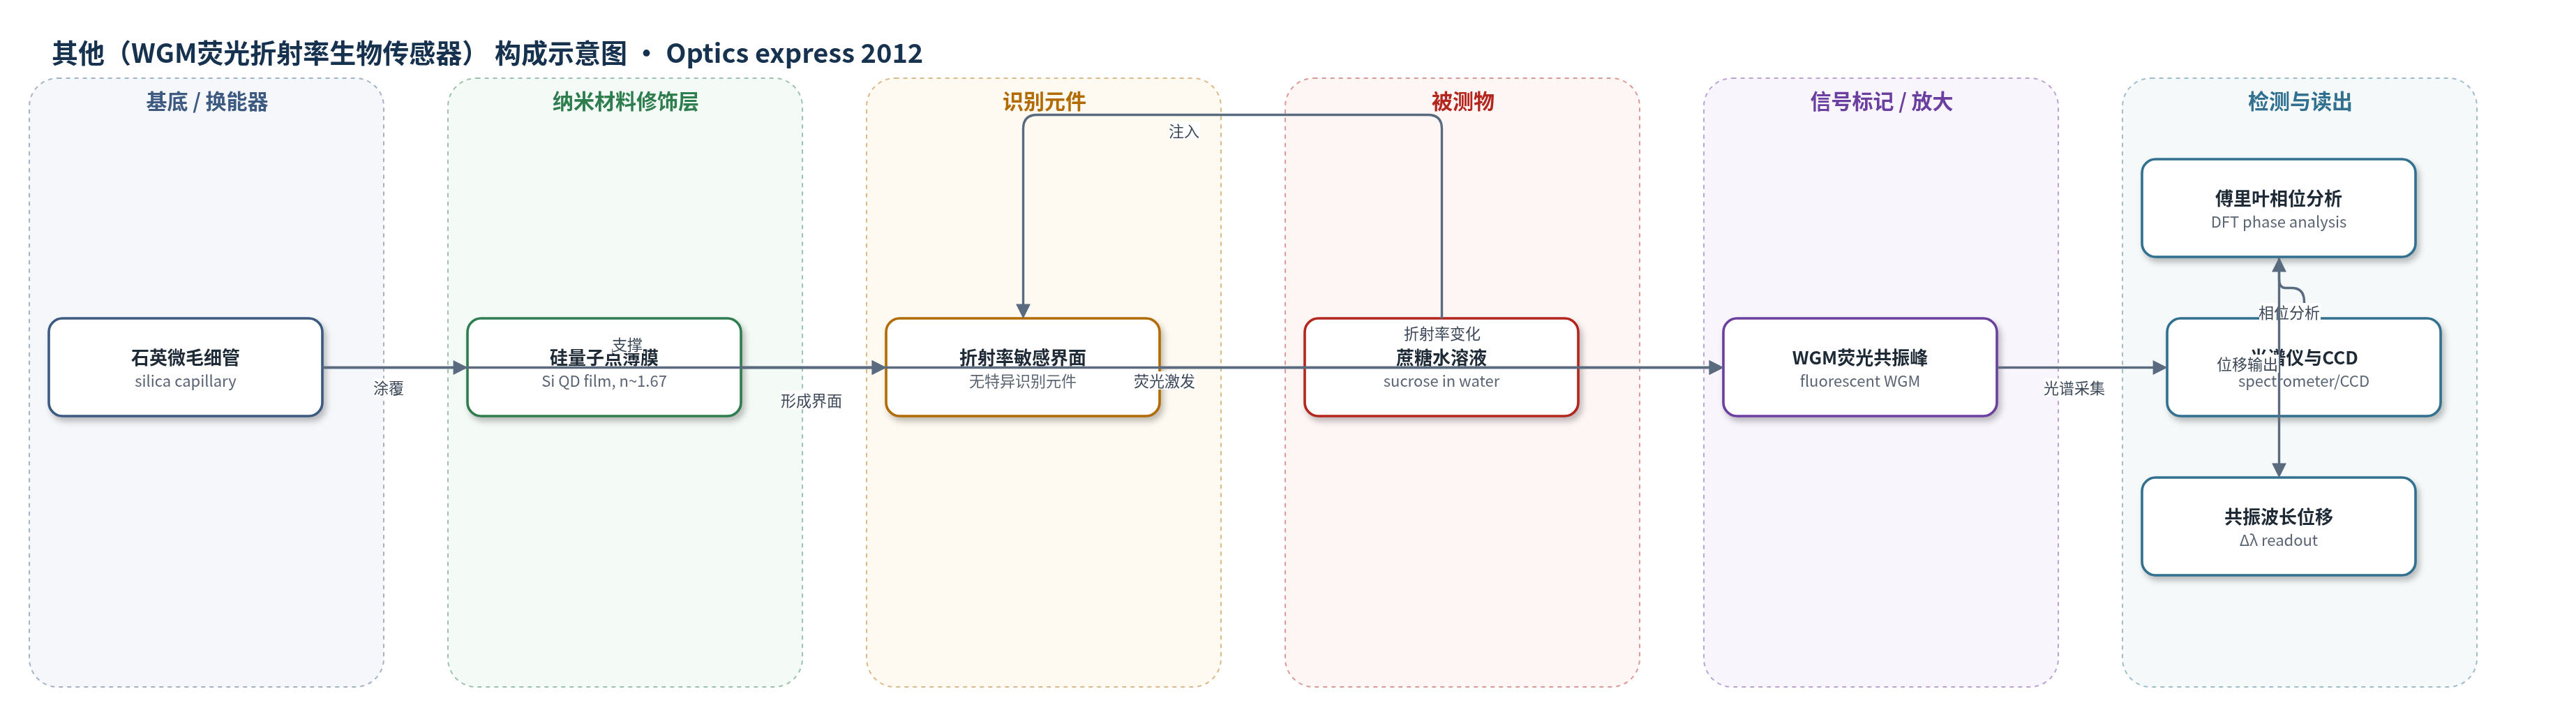
点击图片查看大图 · 依据论文自动绘制
传感器类型
其他(WGM荧光折射率生物传感器)
检测对象
蔗糖(sucrose)水溶液浓度/折射率变化;样品基质:去离子水与蔗糖水溶液
检测原理
蔗糖水溶液注入石英微毛细管通道后,改变腔内局部折射率;硅量子点薄膜支持回音壁模式(WGM),其倏逝场采样通道介质。折射率升高使共振波长红移,位移近似满足 Δλ = S·Δn,文中估计 S≈10 nm/RIU。硅量子点受488 nm激发后发射约800 nm荧光,WGM以荧光峰形式出现在光谱中。由于多个周期性WGM同时被采集,采用离散傅里叶变换(DFT)对相位分量加权回归,可提取整体波形位移,比单峰曲线拟合和峰值拾取具有更高分辨率。该过程无特异性识别或化学放大,信号仅来自折射率变化。
检测灵敏度
灵敏度斜率: ~10 nm/RIU(电磁模拟估计);实验 S: 曲线拟合 15 ± 3 nm/RIU,傅里叶 13 ± 2 nm/RIU(SNR = 3×10^5);3σ 分辨率: 曲线拟合 110 pm,傅里叶 65 pm(SNR = 3×10^5);目标 Δn: 0.0012 RIU;目标位移: ~12 pm;模型 R^2: 曲线拟合 0.97,DFT 0.99
效应效果
该荧光核心微毛细管结构机械稳健,无需锥形光纤、纳米定位或昂贵可调激光,可用405 nm LED激发。实验显示,在SNR=3×10^5时,DFT法3σ位移不确定度为65 pm,优于曲线拟合的110 pm;在1 s采集、SNR≈6时,DFT仍给出57 pm,而0.1 s、SNR≈0.5时仍可分辨位移。相比0.1 nm光谱仪采样间隔,DFT实现约一个数量级的分辨率改善,并较此前测量提高约两个数量级的速度。但装置折射率灵敏度较低(约10 nm/RIU),且存在螺旋模式峰重叠;作者认为傅里叶分析适合荧光WGM实时分析,但实验极限约60 pm,受温度、聚焦和模式重叠等误差限制。
传感器的构成
- 基底/换能器:石英微毛细管(silica microcapillary,内径25 μm),构成微腔通道并支持回音壁模式(WGM)。
- 纳米材料修饰层:硅量子点(Si QD)薄膜,有效折射率约1.67、厚度约0.5 μm,涂覆于通道内壁,提供约800 nm荧光并支持WGM。
- 识别元件:无特异性识别元件(原文未报道抗体、适配体、酶或DNA探针),仅通过溶液折射率变化响应。
- 样品/被测物:蔗糖水溶液(sucrose in water)注入毛细管通道,改变局部折射率。
- 激发源:488 nm Ar+激光(约40 mW)或405 nm LED,激发硅量子点荧光。
- 信号读出:光谱仪/CCD采集荧光WGM光谱,并用峰值拾取、曲线拟合或离散傅里叶变换(DFT)相位分析提取共振位移。
中文摘要
许多微流控生物传感器设计基于光学微腔共振的测量。荧光型谐振器通常比使用可调激光倏逝耦合探测微腔的系统更简单、更稳健。在所有传感器设计中,检测极限取决于检测系统的波长分辨率,而这是荧光型器件的主要限制。本文研究折射率型微腔传感结构的极限分辨率与检测极限。由于荧光谐振器可同时采集多个周期性模式,标准傅里叶方法最适合快速、精确地分析共振位移。作者建立了用于计算极限传感器分辨率和检测极限的简单数值表达式,并将结果与荧光核心微毛细管对水中不同蔗糖浓度响应的实验进行比较。实验采用硅量子点涂层微毛细管,通过蔗糖水溶液改变通道折射率,并比较峰值拾取、曲线拟合与离散傅里叶变换等位移提取方法。
英文摘要
Many proposed microfluidic biosensor designs are based on the measurement of the resonances of an optical microcavity. Fluorescence-based resonators tend to be simpler and more robust than setups that use evanescent coupling from tuneable laser to probe the cavity. In all sensor designs the detection limits depend on the wavelength resolution of the detection system, which is a limitation of fluorescence-based devices. In this work, we explore the ultimate resolution and detection limits of refractometric microcavity sensor structures. Because many periodic modes are collected simultaneously from fluorescent resonators, standard Fourier methods can be best suited for rapid and precise analysis of the resonance shifts. Simple numerical expressions to calculate the ultimate sensor resolution and detection limits were found, and the results compared to experiments in which the resonances of fluorescent-core microcapillaries responded to various sucrose concentrations in water.