组成图示
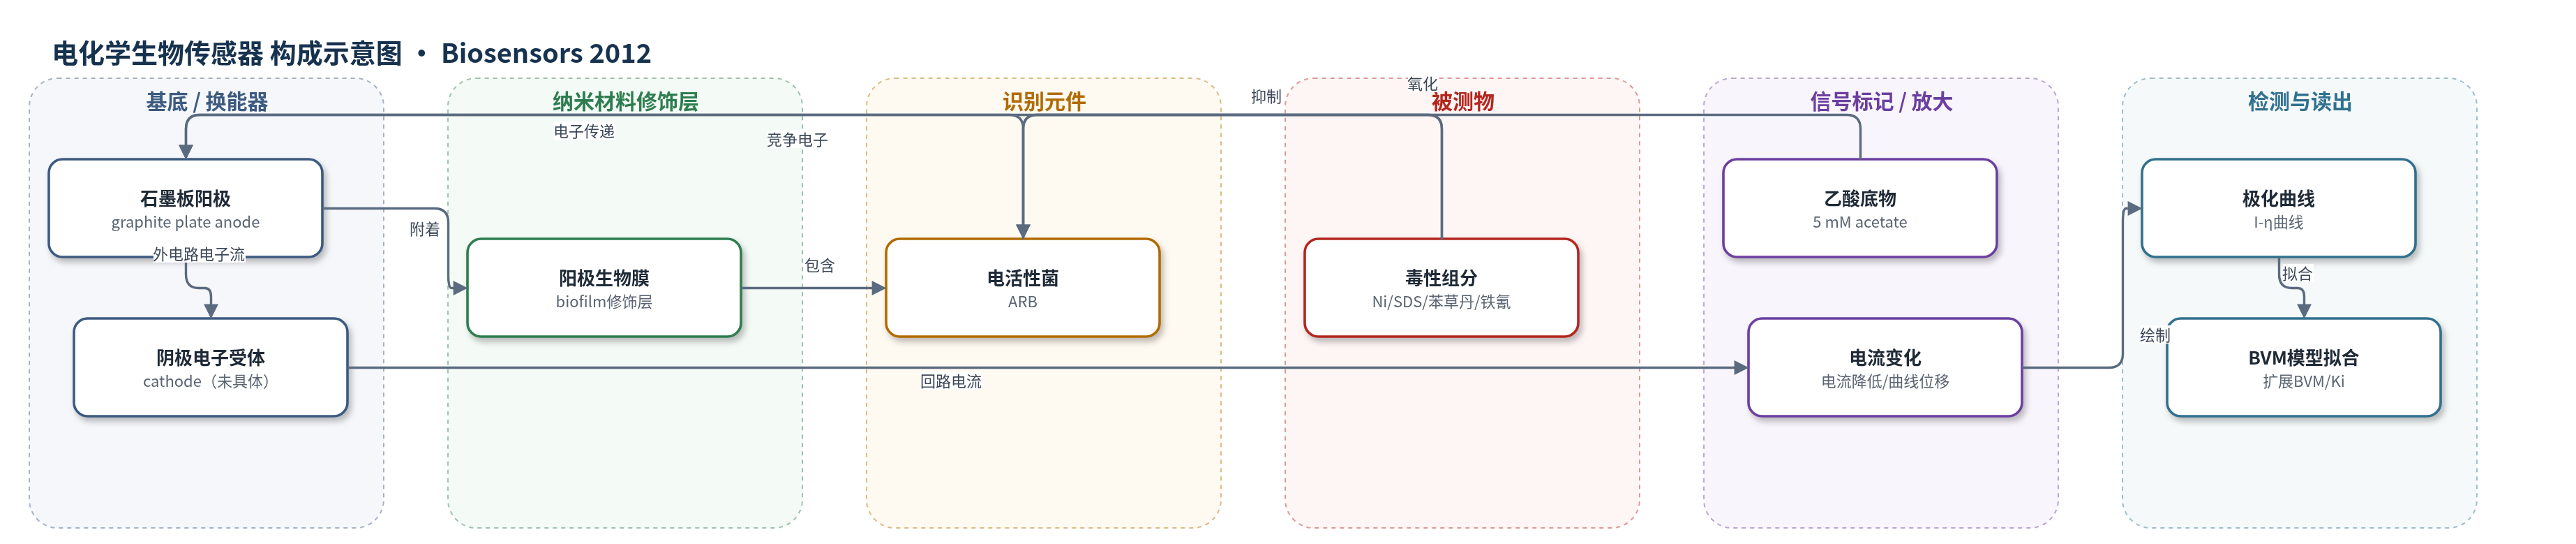
点击图片查看大图 · 依据论文自动绘制
传感器类型
电化学生物传感器
检测对象
镍(nickel, NiCl2)、十二烷基硫酸钠(sodium dodecyl sulfate, SDS)、苯草丹(bentazon)、铁氰化钾/铁氰根(potassium ferricyanide, K3Fe(CN)6/FeCN6^3-);样品基质:水样/厌氧培养基(含5 mM乙酸)
检测原理
MFC中电活性菌氧化乙酸,产生质子、CO2和电子;电子经细胞外途径传递至石墨阳极,阴极电子受体被还原,外电路形成电流。毒性组分进入阳极室后,通过抑制菌体整体活性、改变电化学/生化速率比、影响底物氧化正逆反应或与底物竞争氧化还原复合体等机制,改变阳极界面电子传递,使电流随过电位变化曲线(极化曲线)发生位移或形状改变。实验以Ag/AgCl为参比,将阳极电位从-0.4 V逐步升至-0.15 V并记录电流,得到I-η曲线。随后用扩展Butler-Volmer-Monod(BVM)模型拟合,区分Itox、IK1、IK2、IKm等抑制类型并估计Ki,从而将毒性扰动转化为可量化的电化学信号。
检测灵敏度
原文未报告LOD、线性范围、灵敏度斜率或相关系数。
效应效果
实验对9条毒性极化曲线拟合:7条最佳为Itox,1条(0.5 mM铁氰根)为IK2,1条(50 mg/L SDS)差异不显著。镍10、20、30 mg/L均降低电流,Itox Ki约30.31、31.68、4.57 mg/L;SDS 10、25 mg/L无明显影响,50 mg/L时Itox Ki为85.37 mg/L;苯草丹1、3 mg/L时Itox Ki为3.00、9.11 mg/L;铁氰根0.5、1、2 mM时IK2/Itox Ki为0.11、2.18、10.26 mM。作者认为Ki可表征传感器灵敏度,扩展BVM可区分抑制类型,但混合毒物与浓度效应需改进。
传感器的构成
- 换能器电极:石墨板电极(graphite plate electrodes),构成双室MFC的阳极与阴极,阳极作为固体电子受体
- 阴极电子受体:阴极(cathode)上的电子受体,接受外电路电子并被还原(原文未给出具体材料)
- 识别元件:电活性微生物混合培养/阳极生物膜(electrochemically active bacteria, ARB; biofilm),氧化乙酸并向阳极传递电子
- 样品基质:厌氧培养基/阳极液(anolyte),含5 mM乙酸(acetate),通氮气,连续流速0.7 mL/min
- 被测物/信号扰动:毒性组分(nickel chloride/Ni、sodium dodecyl sulfate/SDS、bentazon、potassium ferricyanide/K3Fe(CN)6),加入阳极室改变电流
- 电子供体:乙酸(acetate, 5 mM),作为有机底物被电活性菌氧化
- 信号读出:电位控制与电流测量(anode potential stepwise -0.4 to -0.15 V vs Ag/AgCl; current measured),绘制极化曲线
中文摘要
极化曲线对基于微生物燃料电池(MFC)的生物传感器检测毒性组分至关重要。本研究在非毒性条件以及分别添加不同浓度镍、苯草丹、十二烷基硫酸钠(SDS)和铁氰化钾的条件下测定MFC极化曲线。实验结果表明,毒性组分会改变电活性细菌的代谢与电子传递,使极化曲线发生位移。作者采用Butler-Volmer-Monod(BVM)模型及扩展BVM模型描述非毒性和毒性条件下的极化曲线,并通过加权最小二乘/线性回归方法拟合模型参数。结果表明,不同毒性组分可对应不同的动力学抑制类型,并可估计各毒性组分的抑制常数Ki。Ki值反映传感器对特定毒性组分的灵敏度,可用于毒性组分生物传感器的选择与评价。
英文摘要
Polarization curves are of paramount importance for the detection of toxic components in microbial fuel cell (MFC) based biosensors. In this study, polarization curves were made under non-toxic conditions and under toxic conditions after the addition of various concentrations of nickel, bentazon, sodiumdodecyl sulfate and potassium ferricyanide. The experimental polarization curves show that toxic components have an effect on the electrochemically active bacteria in the cell. (Extended) Butler Volmer Monod (BVM) models were used to describe the polarization curves of the MFC under nontoxic and toxic conditions. It was possible to properly fit the (extended) BVM models using linear regression techniques to the polarization curves and to distinguish between different types of kinetic inhibitions. For each of the toxic components, the value of the kinetic inhibition constant Ki was also estimated from the experimental data. The value of Ki indicates the sensitivity of the sensor for a specific component and thus can be used for the selection of the biosensor for a toxic component.