组成图示
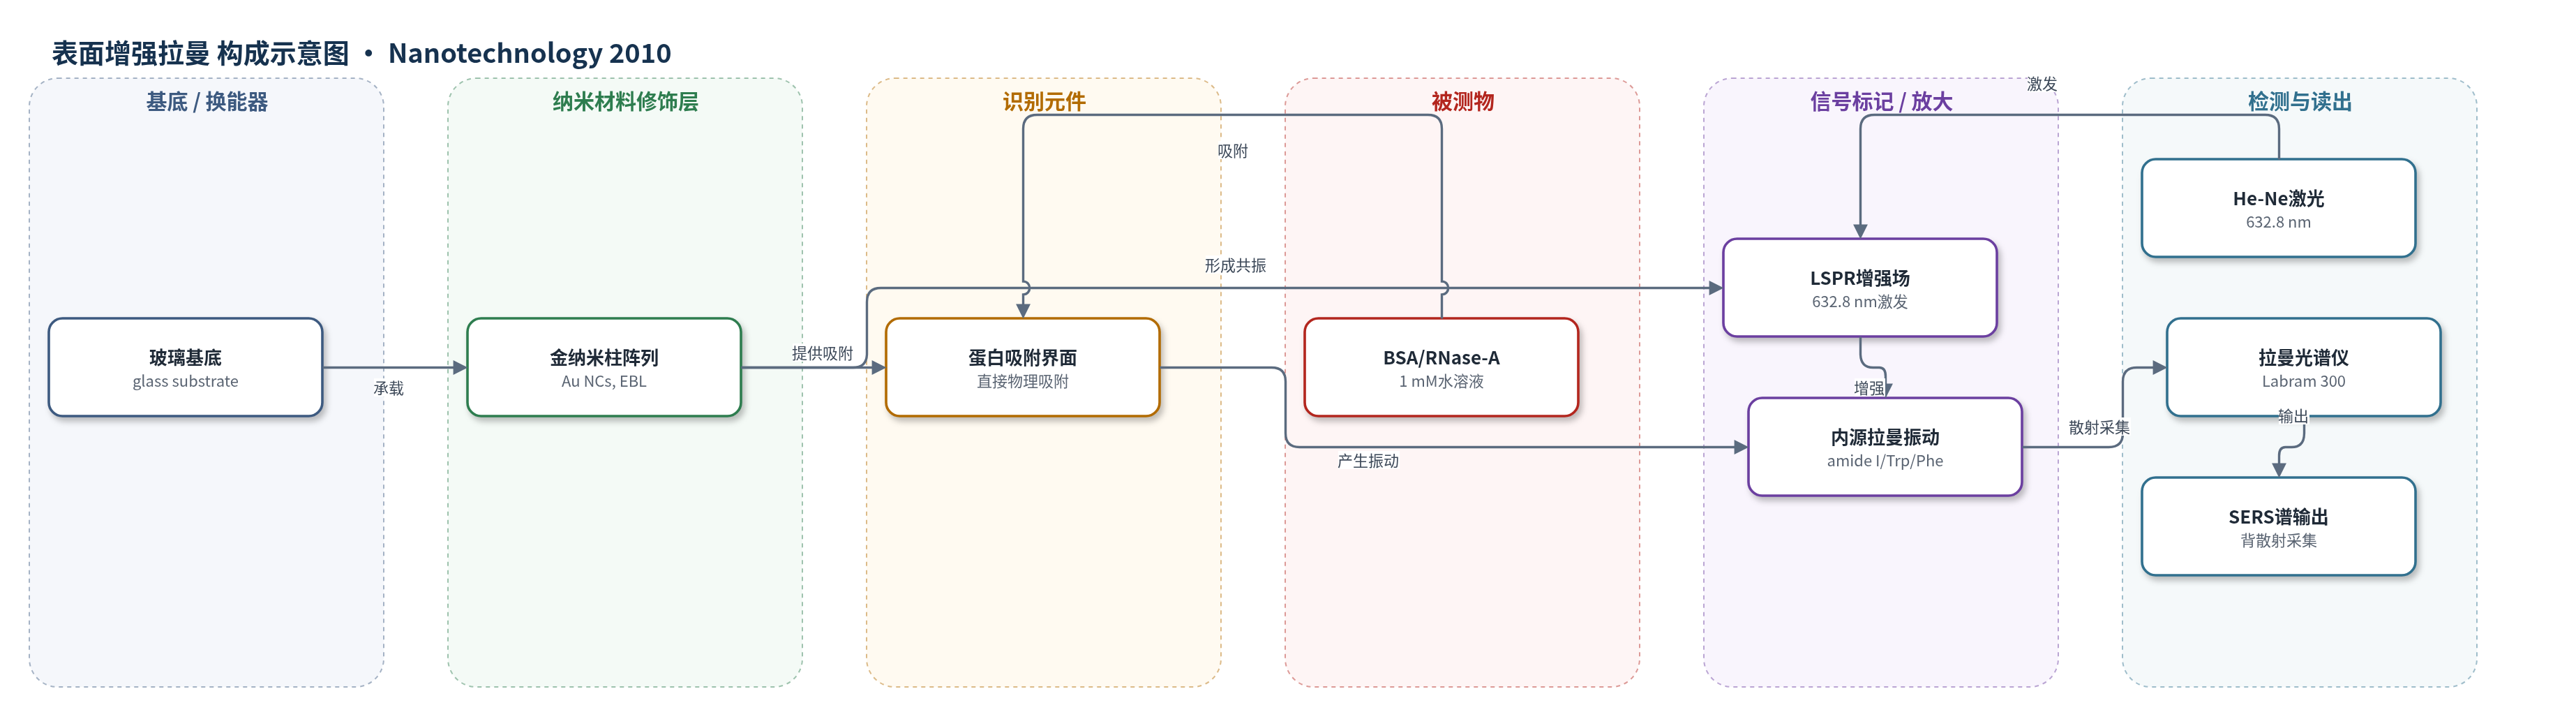
点击图片查看大图 · 依据论文自动绘制
传感器类型
表面增强拉曼(SERS)生物传感器
检测对象
牛血清白蛋白(bovine serum albumin, BSA)、核糖核酸酶A(ribonuclease-A, RNase-A);样品基质:高纯水/水溶液(1 mM,滴干)
检测原理
将1 mM BSA或RNase-A水溶液滴于EBL制备的金纳米柱阵列上并干燥,蛋白直接物理吸附于金表面形成单分子层。632.8 nm He-Ne激光激发金纳米柱的局域表面等离子体共振(LSPR),在纳米柱间隙和表面附近产生强局域电磁场,使吸附蛋白的拉曼散射发生电磁增强,化学电荷转移贡献较小。SERS峰强与表面吸附蛋白数量及浓度相关。通过改变纳米柱直径调节LSPR位置,当LSPR位于激光激发波长与目标拉曼带之间时增强最大。拉曼光谱仪背散射采集特征峰,如BSA的amide I 1658 cm−1和RNase-A的Trp/Phe 1614 cm−1,据此实现蛋白光谱检测。
检测灵敏度
LOD: close to 10−4 M for BSA and between 10−4 and 10−5 M for RNase-A
效应效果
该EBL金纳米柱阵列具有可重复的纳米结构,作者称其有助于获得可重复的SERS基底和蛋白SERS谱;拉曼峰位重现性在±1 cm−1以内。BSA的SERS谱与溶液/粉末拉曼谱相近,未见明显构象变化;RNase-A出现酰胺带缺失和芳基振动增强,提示表面吸附引起二级结构变化。信噪比BSA约10、RNase-A约60,估算LOD为BSA约10−4 M、RNase-A约10−4–10−5 M。摘要与结论报告增强因子约10^5(BSA)和10^7(RNase-A)。未使用抗体等特异性识别元件,选择性有限,但作者认为通过功能化和参数优化可发展为高重现性SERS生物传感器芯片。
传感器的构成
- 基底:玻璃片(glass substrate),承载金纳米柱阵列并提供光学透明支撑
- 纳米材料修饰层:金纳米柱阵列(Au nanocylinders, Au NCs),由电子束光刻(EBL)和lift-off制备,直径100–180 nm、高50 nm、间距200 nm,提供LSPR增强场
- 识别/吸附层:未使用特异性识别元件,BSA或RNase-A直接物理吸附于Au NCs表面,形成单分子层
- 信号标记物:无外源标记物,蛋白自身拉曼振动(amide I、Trp/Phe芳基振动)作为内源SERS信号
- 激发/换能:632.8 nm He-Ne激光激发Au NCs的LSPR,增强吸附蛋白的拉曼散射
- 读出:Jobin-Yvon Labram 300微拉曼光谱仪,100×物镜背散射采集SERS谱
中文摘要
本文报道了基于电子束光刻(EBL)制备的金纳米柱阵列的表面增强拉曼散射(SERS)基底,用于牛血清白蛋白(BSA)和核糖核酸酶A(RNase-A)的精确光谱检测。金纳米柱直径为100–180 nm,柱间间距为200 nm。作者表明,通过优化光刻金纳米柱的尺寸和形状,可在较低浓度下获得蛋白质的SERS谱。该SERS研究使作者能够估计1 mM浓度下蛋白质拉曼谱重要谱带的高增强因子,BSA约为10^5,RNase-A约为10^7。研究还表明,为获得最高增强,必须优化SERS信号,而主要优化参数是局域表面等离子体共振(LSPR)位置;LSPR应合适地位于632.8 nm激光激发波长与所研究拉曼带位置之间。该研究强调了金纳米柱阵列在蛋白质光谱检测中的效率。
英文摘要
In this paper we highlight the accurate spectral detection of bovine serum albumin and ribonuclease-A using a surface-enhanced Raman scattering (SERS) substrate based on gold nanocylinders obtained by electron-beam lithography (EBL). The nanocylinders have diameters from 100 to 180 nm with a gap of 200 nm. We demonstrate that optimizing the size and the shape of the lithographed gold nanocylinders, we can obtain SERS spectra of proteins at low concentration. This SERS study enabled us to estimate high enhancement factors (10(5) for BSA and 10(7) for RNase-A) of important bands in the protein Raman spectrum measured for 1 mM concentration. We demonstrate that, to reach the highest enhancement, it is necessary to optimize the SERS signal and that the main parameter of optimization is the LSPR position. The LSPR have to be suitably located between the laser excitation wavelength, which is 632.8 nm, and the position of the considered Raman band. Our study underlines the efficiency of gold nanocylinder arrays in the spectral detection of proteins.